
by, Barclay T. Leib
December, 1999
As the Dow Jones Industrial Average flirts with its August 25 highs, many a short seller has been left agog and perplexed trying to pick a top. Market bear David Tice of the Prudent Bear Fund has seen his heavily short-oriented fund decline by over 30% since last February, and Bob Prechter, of Elliott Wave International, a highly successful market timer from the 1980's, has seen his subscriptions diminish in recent years as he has increasingly searched for "the top."
And yet, we all know that at some level, the recent equity froth is likely to end, and could end quite badly. What no one of course knows -- and what is always difficult to determine in a parabolic advance -- is a natural target level at which it might do so.
There is one level that we are quickly approaching, however -- 11,541 basis the Dow Jones Industrials -- that if you believe in one 13th century Italian mathematician should be of great significance.
For those not familiar with him, let me introduce here: Leonardo Fibonacci (1175 AD - 1250 AD) -- a man often called the greatest mathematician of the Middle Ages -- and someone with whom most market technicians are already familiar. Born in Pisa, Italy and educated in Bougie, North Africa, Fibonacci was the first person to introduce the Hindu-Arabic number system 0,1,2,3,4,5,6,7,8 and the decimal point to Europe in lieu of Roman numerals. He also developed a unique sequence of numbers now termed the Fibonacci Sequence: 1,1,2,3,5,8,13,21,34,55,89.... where each number added to the one immediately preceding it equals the following number. In addition, Fibonacci noted that each number divided by the next adjacent number quickly approaches the so-called "Golden Ratio" of .618.
Fibonacci numbers and this ratio seem to appear throughout nature, science, and art far too often to be a random or freak occurrence. 1-.618 which equals .382, and 1 +.618 or 1.618 also seem to appear with much proclivity, while .618 x .382 which equals .236 is a ratio found perhaps less often but still of some importance. Here are a few examples:
In many plant species, the number of petals on a flower is a Fibonacci number: Buttercups have 5 petals, Lilies and Iris have 3 petals, Delphiniums have 8 petals, Corn Marigolds have 13 petals, Asters have 21 petals, and Daisies have 34, 55, or 89 petals. Even the way a plant grows its limbs occurs in a Fibonacci manner.
Fibonacci relationships also show up in famous paintings by Leonardo De Vinci which, when measured, just happen to be 1.618 times as long as they are tall. Leonardo De Vinci was very aware of the size of his canvas to make sure that it was pleasing to the human eye. Interestingly, the shape of playing cards, which typically have a height 1.618 times their width, is also pleasing to the human hand.
In architecture, the Greeks built the Parthenon in Athens 1.618 times as wide as it is tall, using a Fibonacci eight columns to adorn its facade. Similarly, the famous Giza Pyramid in Egypt has a height 1.6180 times half the length of its base.
On the human body, is it a coincidence that we have one head, two hands, each hand having five fingers, and each finger having three knuckles? The belly button on a human body is also usually located about .618 up our body.
In a similar manner, Fibonacci ratios are often used in financial markets to predict retracement moves. Between 1985 and 1995, the U.S. dollar fell from a high of 3.3480 DM to a low of 1.3454 DM. A "natural" minimum retracement of this decline that a trader might expect to transpire at some point would be a 38.2% retracement of the distance between those two extremes, or a move up to 2.1104. 1.618 times the 1995 low of 1.3480 equals 2.1811. The band between 2.1104 and 2.1811 thus becomes a logical minimum target zone for a rally that would fit nature's general rhythm. A full .618% retracement of the 1985-1995 decline would yield a target of 2.5830 -- a level certainly possible with time, but which would be unlikely to be reached before a tremendous amount of work between 2.1104 and 2.1811 first.
In the present circumstance, looking at the DJIA, let us see if we can use a bit of Fibonacci to target a logical "natural" level for the current parabolic rise in the DJIA to put in a finale. Spending considerable time looking at the distance of rallies to successive highs all the way back to the 1903 all-time low of 29.9 on the DJIA, one discovers the following:
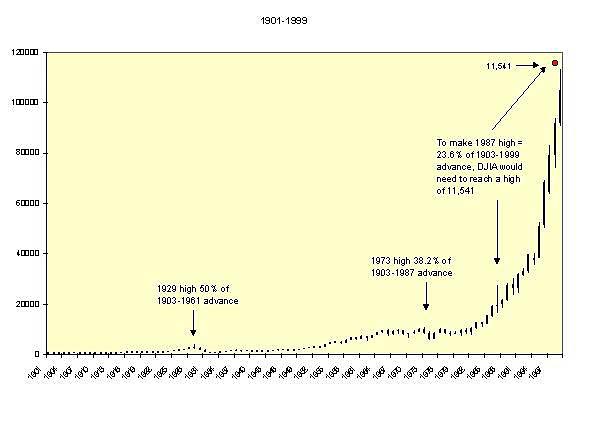
If this technique works, will this be the "final" high for years and years to come? The strength of one's conviction increases when considering that .382 x .236 or .0901 times the advance from 1903 to our projected high of 11,541, when added to the 1903 base equals 1067 -- the 1973 high showing up yet again! Nature is sure to be truly happy with this 11,541 level. It may not stand forever, but if Leonardo Fibonacci were alive today, he would certainly argue that such a high would be likely to stand for a long time.
Barclay Leib is an analyst, trader, and freelance writer who has worked with Fibonacci techniques for over eighteen years. He has sucessfully applied his analysis to trading positions at several different institutions including JP Morgan, J Aron Goldman Sachs,Barclays Bank, and Societe Generale. Mr. Leib has been published by Derivatives Strategy Magazine, Bloomberg, PrudentBear.com, and the Princeton Economic Institute. He may be reached by e-mail at BTLEIB@AOL.COM.