Sand Spring Advisors LLC
I had dinner a few nights ago with a fellow who was recently hired as a "gray hair" to add respectability to a New York based dot-com company. Despite lucrative stock options that will vest in one-year's time, he is leaving after just five weeks on the new job. The reason: "There is just outright fraud going on. I listened to the chairman of this company literally lie at an analyst meeting last week. No one is really going to make any lasting value in this business. The only thing anyone wants to really do is to get enough "eyeballs" to justify an IPO, and then to cash out. It's dangerous and sick."
Perhaps this fellow just picked the wrong company, but if our analysis below is correct, this will not be the last such story we expect to hear. We base our bearish view on five astounding perspectives.
First let's picture the current Nasdaq versus a comparable example of a parabolic advance back in 1980 -- gold. As late as November 1978, gold was trading at as low a price as $193.40. Then it went on a 14-month tear up to a January 1980 high of $850. This was an advance of some 493%, or an average gain of 60.7% a month through this last parabolic blowoff.
- 1) A comparison of 1980 gold's parabolic advance to that of the current Nasdaq
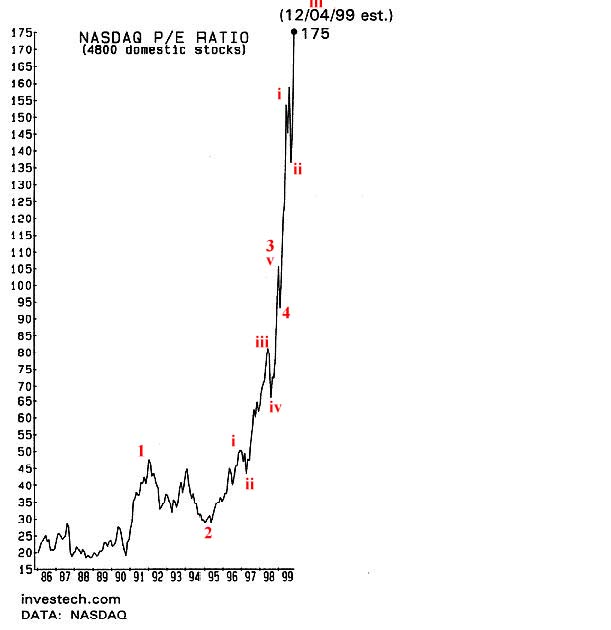
- 2) A look at the Price/Earnings of the Nasdaq and a potential Elliott wave count thereof.
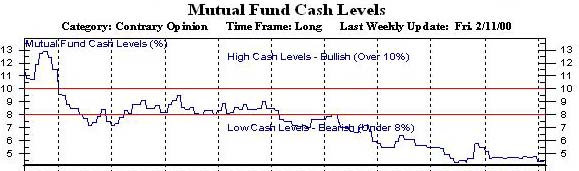
- 3) A look at mutual fund cash availability
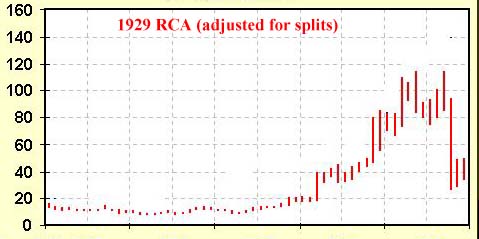
- 4) A look at AOL in 2000 vs. RCA in 1929
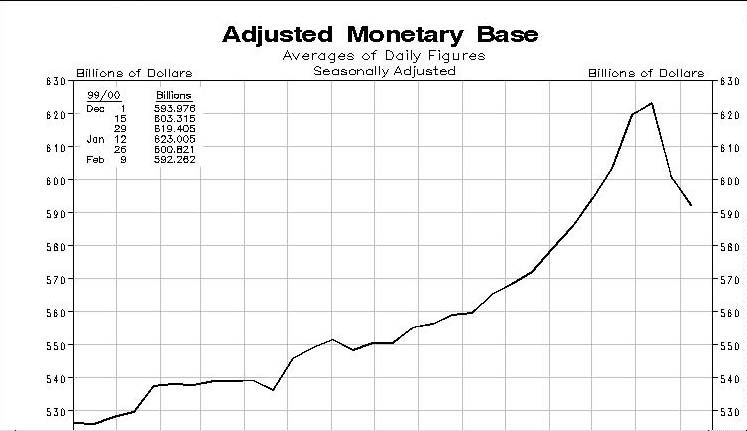
- 5) A look at the Monetary Base
Now let's look at the Nasdaq 100. As recently as April 1997 it was trading as low as 779.17. In October 1998 it was still just 1063.27. Then, within a 17-month period to February 2000, it has vaulted as high as 4297. This has been an advance of some 404%, or an average gain of 23.76% per month.
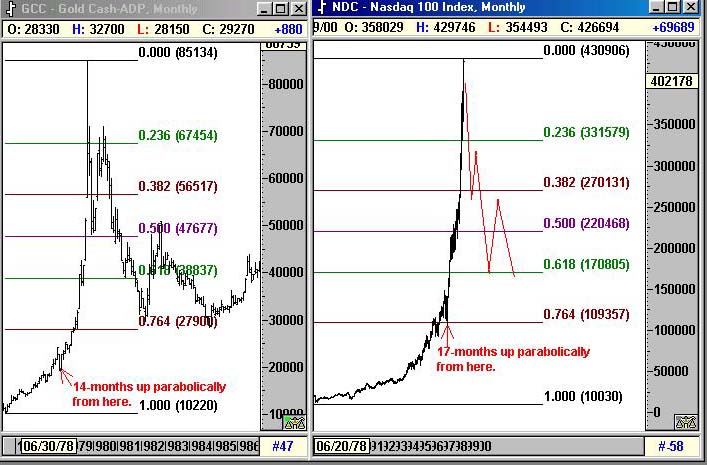
The similarities in structure are clear. Both charts achieved nearly 75% of their respective total gains in the last year+ window of time.
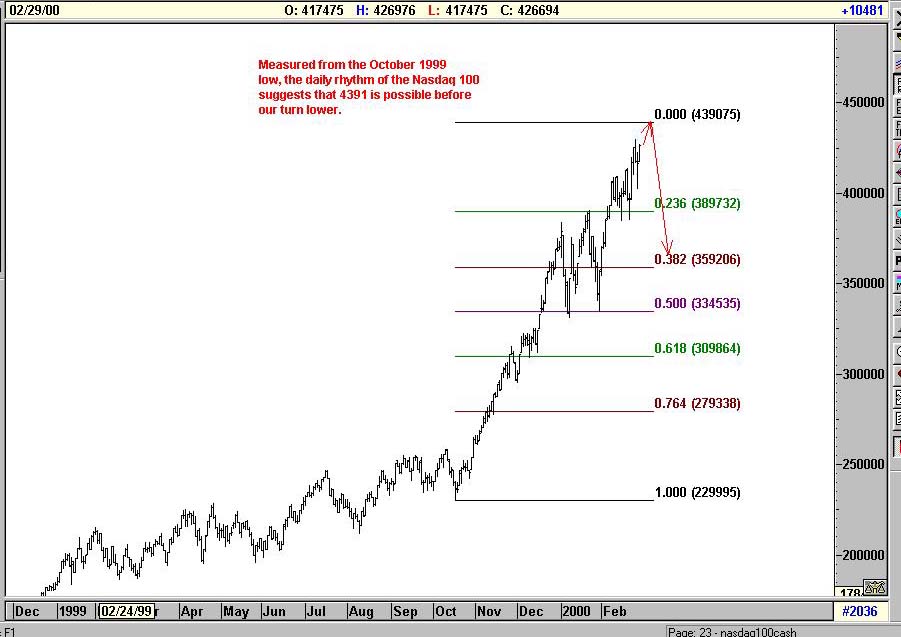
On a minuette basis, we see the possibility for a minor new high in the Nasdaq 100, but 4390 should be about the extent of it. In addition to the monthly picture below, numerous Fibonacci relationships look quite "tight" there including the daily picture that follows.
The second chart is of the Price-Earnings Ratio of the Nasdaq Composite taken as of early December by Investech. Since that time, the Nasdaq composite has rallied another 30% which basis similar levels of earnings would put this chart closer to 235-1 now! In January, the Nasdaq realeased figures claiming the P/E was still only has a P/E of 187-1, but we believe Investech's calculations more than the Nasdaq's which historically have been kept purposefully on the low side. Be forewarned this chart may give you a nosebleed. For anyone who believes in Elliott Waves, we believe that this chart reached a iii of V position in late December 1999, made a iv of 5 a-b-c correction in January, and is currently completing a v of V. Since extended 5th waves normally retrace their entire distance twice, we see the first logical downside target here to be a P/E toward 100-1 near the prior 4th wave. This would equate to an approximate 38.2% decline in price.
The third chart we offer is one of Mutual Fund cash balances that now stand at a record low. Fidelity now has a "cash police" squad made up of senior people to make sure that their individual managers don't think too much and sit on any excess cash reserves. Historically, cash reserves below 8% have been a warning sign of investment excess. The current 4% level looks to us to be dangerously low, and potentially the end of 5 waves down from 1998. If mutual funds are fully invested, who is going to be there to buy stocks when they fall? What is going to happen if mutual fund inflows suddenly reverse?
Let us quote here from one of the best, most honest, and most objective high tech analysts around. This is Fred Hickey of the High Tech Strategist, and the following is what he wrote in early February about how poorly diversified many of the mutual funds are. He specifically chose to look at the concentration of holdings by mutual fund company Janus:
"[Their] flagship Janus Fund...has Sun Microsystems...as its top holding, and Cisco… at number five. In the Janus Twenty Fund, Cisco is the number three holding, Sun Microsystems is number four, and Microsoft is number five. Want some international diversification? The Janus Worldwide Fund has Cisco at #2 and Microsoft at #4. The Janus Global Technology Fund has Sun Microsystems as its top holding, with Cisco at #6. Of the top-ten holdings in this supposedly global fun, all but one, Nokia, is a high momentum, U.S.-based tech darling. Cell phone leader Nokia is a popular holding throughout the [entire] Janus Fund family. It's the top holding at the Janus Olympus Fund, just ahead of Sun Microsystems at the #2 spot and Cisco at #3. You can also find Nokia as the top holding at the Janus Mercury Fund…with what else?, Cisco Systems. Interested in a more subdued growth and income (generally meaning some bonds and dividends) fund? The Janus Growth and Income Fund has Cisco at its current top position, Sun Microsytems at #3 and Microsoft at #5."Now with diversification like that - and Janus is not the only culprit by far - we believe the definition of a classic "crowded trade" exists. Everyone is buying the same tech stocks regardless of the fundamentals and valuations under the pretext of a technological "new paradigm." People are chasing dreams of riches, and the mutual fund managers are chasing the fees that come with the dream. Think too much as a fund manager, hold back at all, and you are fired. This is leaving a large potential black hole under the market when all these same people - for whatever reason - want to sell. They all own the same thing. They have convinced themselves that there is no downside, but there always is of course, as RCA so aptly proved in the Crash of 1929.
RCA was the technological darling of that prior era - the leader in both radio and later television that had a huge future ahead of it. And yet somehow, from its 1929 peak valuation RCA subsequently lost 93% of its value and took 35 years to regain the same price level it held in 1929 once again. As of 1929 only a third of Americans already had radios, just as today approximately a third of Americans have used the Internet. The growth potential was very similar. Throughout these years RCA was a great company in a great industry. It's simply that its 1929 valuation was so far out of whack with its true revenue prospects that RCA, the stock, made a horrific investment at that time.
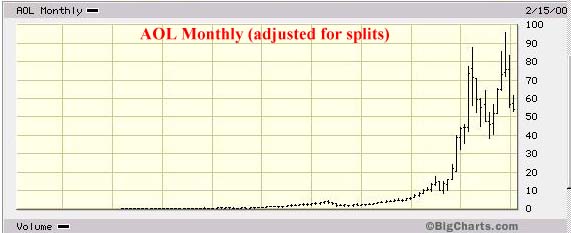
Many people have tried to analogize RCA to different high tech stocks in the current mania, but none probably "fit" as well as AOL. Not only are both companies a three-letter acronym in name, but AOL led the way to making the Internet accessible and user-friendly just as RCA led the way to having a radio and television in every household. Both for their respective eras were one of the few high tech companies already profitable. Indeed, their chart patterns are also now looking remarkably similar as this is typed. Both stocks made a momentum high, a deep retracement, and then one final lurch to a marginal new high before beginning a sudden collapse. If this analog continues to hold, then the crash of 2000 has already begun - it's just that nobody has really admitted it yet. In addition, AOL has of course a large Achilles heal: it is now a premium-priced service in an industry that is quickly giving away ISP access. Paying that $21.95 a month could be one of the first things to go in a serious recession, assuming other ISP providers are still around providing such service for free.
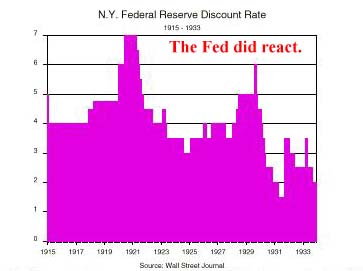
But many would say: the Fed will never allow the equity market to collapse - they are too omnipotent, and have learned how to handle previous crises in 1987, 1995, and 1998. Well, the chart below is an ominous signal that the Fed is no longer on the market's side. Credit has expanded too far, too fast, driven by a monetary base that the Fed purposefully allowed to expand at a rapid pace into Y2K. Now that expansion is all over. The monetary base is headed down, and will likely do so, first at the Fed's explicit behest, and then later - after the crisis - as people scramble to close down debt obligations and get themselves less leveraged. Few people realize that despite the Fed's success in 1987 and 1998 at containing a crisis, they actually cut rates over 15 times post the 1929 crash from 6% to 1.5%, but all to no avail. So too did the Japanese post their 1990 equity market collapse to the point where Japanese rates are now effectively zero.
Central bankers, and particularly Alan Greenspan have been deemed omnipotent in recent years, but many forget that prior to public life Alan Greenspan was once simply a private economist with a less than stellar ability to prognosticate the U.S. economy during the late 1970's and early 1980's. Indeed, Greenspan probably stands as amazed as anyone at how resilient and effervescent the current expansion has been. He thought we had a bubble 5,000 points ago on the DJIA. Now he has simply given up trying to read too much into the equity froth. Privately it concerns him dearly, but he is also deathly afraid to do anything untoward to potentially trigger its end. So he has simply become agnostic, massaging monetary policy from quarter to quarter and letting neophyte investors enjoy the good times as long as they last. People think that he is a Wizard of Oz, but he is indeed human and fallible. Retrospectively, we believe his biggest mistake will go down in history to be his continued support of off-balance sheet derivatives.
So what might be the timing of a crash? Going back to our analog chart of 1980 gold, one will notice that after the 14 months up, we had a sharp three months down followed by a rebound attempt of six months. If the Nasdaq were to peak right here in February near current levels, a similar pattern would call for us to trade down sharply for three months into May (May 5-6 also being an important cycle period as well - see our December cycle report), before rebounding into November, 2000. If we don't collapse in February or early March, then the Nasdaq could extend its rally until May, and then collapse in an equally vicious way thereafter.
Either path remains possible as this is typed, but the former we think a bit more likely. Something of a disaster right now would serve to spice up the Election 2000 dialogue and get more people once again watching "Meet the Press," followed by an ever-optimistic American public buying stocks yet again (albeit from significantly lower levels) into the U.S. elections with the belief that all will be fine once the Republicans come back to reside in the White House. Certainly a crash type event now would increase the Republican Party's chances of winning, albeit post November, the stock market is likely to roll over once again no matter who holds reign at Pennsylvania Avenue.
So if we do crash now, where's the first stopping point, per the title of this article? Assuming one more small marginal high to 4390, 2726.63 would represent a 50% retracement of the October 1998-February/March 2000 advance. 2751.22 would represent a 38.2% retracement of the Nasdaq 100's entire advance since its inception at an index price of 100. 2793.38 would also represent a 76.4% retracement of the upmove from the October 1999 low. One must remember we are using an extrapolated 4390 high for these calculations. Our definitive high is not quite etched in stone, and we will update our thoughts once it is, but it is into this 2726-2793 range that we would expect a good Wave 1 down to eventually carry us. The recent 5th wave advance of the Nasdaq has been so fast and furious, it could easily be just as fast and furious headed back down to this target.
If we see 5-waves down to 2726.63-2793.39, then think about buying for a trade - a quick flip -- but not before. This is the round of things where premature bottom pickers may well get shown the door.
| Corporate Office: 10 Jenks Road, Morristown, NJ 07960 Phone: 973 829 1962 Facsimile: 973 829 1962 |
Best Experienced with
The material located on this website is also the copyrighted work of Sand Spring Advisors LLC. No party may copy, distribute or prepare derivative works based on this material in any manner without the expressed permission of Sand Spring Advisors LLC
This page and all contents are Copyright © 2000 by Sand Spring Advisors, LLC, Morristown, NJ