Sand Spring Advisors LLC
For sometime we have been generally neutral stocks, and pointing to the September period for possible resolution of recent sloppiness. As stated on numerous occasions, the current break higher in the Value Line Index out of a multi-month coil appears bullish, whereas we feel the Nasdaq pattern is less so - having the look and feel of an Elliott wave a-b-c 2-wave rally before a devastating third wave down.
We have also pointed to the week of September 4th as a "panic cycle" week basis the old Princeton Economic weekly cycle maps. This means that it will be a particularly volatile one, and could represent either a runaway breakout or an "outside-reversal" top type of pattern. Choosing which it will be obviously is of some importance.
We have perused over 100 individual equity chart patterns and the majority certainly appear "complete" to the upside on a Fibonacci rhythm basis. This includes such power-house high cap names as GE, Intel, and Micron. A significant high in the broader indices could now come at any time, although minor further strength in the NYA index up toward 689-696 region is likely before the downdraft begins.
But what happens if everyone returns from vacation, stampedes into Wall Street the first week of September, and just keeps buying -- as some pundits expect? That's certainly possible of course, but even if that were to occur, let us point to one "look-alike" chart comparison of which we are quite enamored.
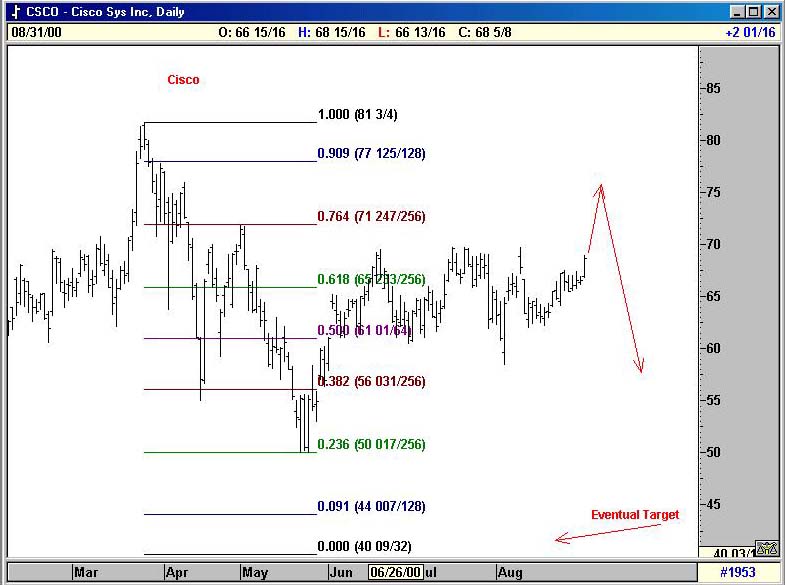
On the following page we compare the current daily chart of Cisco with a vintage picture of the top in the DJIA in 1969 - the end of the so-called go-go years.
Note in the construction of the Cisco price action, there is an upward sloping wedge that formed in the first leg down of its April corrective period. This is followed by a further collapse and then a backing and filling period where Cisco has been trying to break back above a downtrend line. Thursday, it appears to have done so.
Then compare this chart to one of the Dow Jones between October 1968 and February, 1970. We spy in this latter chart a very similar upward sloping wedge formation in the initial part of a corrective slide, followed by much backing and filling, then a significant but eventually false break higher, followed by a collapse that lasted for over a year.
In our mind, Cisco, as an individual equity, now appears poised to follow a very similar path - when the buffoons and momentum players post-Labor Day decide they have to buy it, but then find themselves holding the bag just a few weeks later.
Note that the magnitude of the initial up-move ("false break") might be impressive. If Cisco follows the 1969 DJIA "look-alike" map, it could easily see the low- to mid- $70s. CNBC will likely be high-fiving themselves that the bull market is back. The problem is: it won't be. Instead, the old highs in Cisco should repulse this final advance, and the real move will be to the downside. After the low- to mid- 70's, the $40 region for Cisco should be the next stop. Note the nice tight Fibonacci rhythm depicted below to such an extrapolated low.
So even if we were to break higher next week in Cisco (which may appear likely on a pattern-match basis, even if we are on the lookout for a possible outside reversal down in the broader market), next week's upside excesses are still likely end up in tears come the year 2001. And unfortunately, neither George W. Bush nor Al Gore has the personal charisma to be anything but despised when that slide eventually transpires.
Just for the record, in our published "Failed Accounting Standards…" article of July 21, 2000, we showed the following expected path for the Nasdaq, with all the arrows left completely unchanged here and just the data updated. So far so good. Wall Street's ever-present froth may delay any true downside break until the mid- to latter part of September, but if you're into top picking, now is the time to start looking.
Basis some longer term cycles, September 13th would be the idealized day for a high. It represents one-quarter of the distance in the 3,141 day (pi x 1000) 8.6 year PEI economic confidence interval that started on the July 20, 1998 equity high.
And what catalyst for the eventual decline you ask? Certainly an exploding oil price, a collapsing euro, a soggy JGB market all provide potential ammo. Gold even perked up today, and the chart of Anglogold (AU-NYSE) still looks powerful and bullish. Perhaps strength in this latter market might suddenly take the underpinnings away from the broader equity indices.
At the end of the day, however, it will probably be some simple realization that there is no real chip shortage, that there is no pent-up PC demand, or no supply shortage of mobile phones -- that will do the trick.
Once that realization takes hold, the power of entropy will do the rest.
Most of the high-paid analysts of Wall Street will suddenly be shown for what they truly are: stock pushers, peddling daily pabulum that the masses blindly want to sample and believe in. As always, consensus conclusions create - in the end -- careless consequences.
Send us your comments at information@sandspring.com
| Corporate Office: 10 Jenks Road, Morristown, NJ 07960 Phone: 973 829 1962 Facsimile: 973 829 1962 |
Best Experienced with
The material located on this website is also the copyrighted work of Sand Spring Advisors LLC. No party may copy, distribute or prepare derivative works based on this material in any manner without the expressed permission of Sand Spring Advisors LLC
This page and all contents are Copyright © 2000 by Sand Spring Advisors, LLC, Morristown, NJ